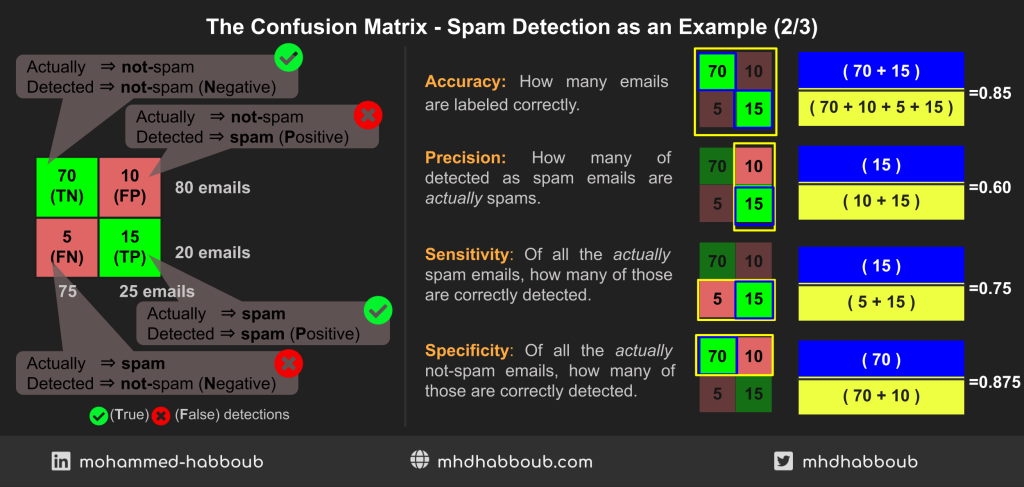
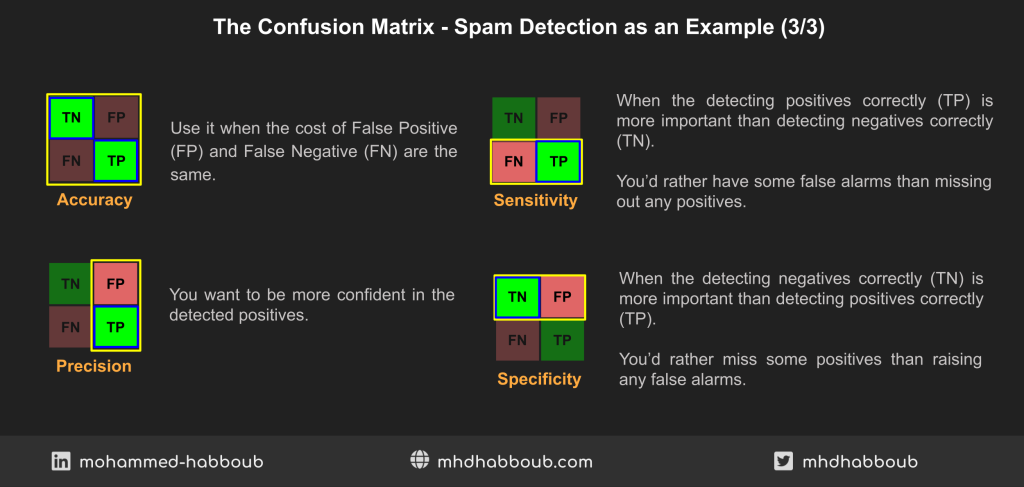
Days 2, 3 and 4 of #66DaysOfData. Refreshing my understanding of the “Confusion Matrix” and summarizing my it visually in the 3 illustrations below. High five to @joshuastarmer and his amazing Youtube channel “StatQuest with Josh Starmer“.

Days 2, 3 and 4 of #66DaysOfData. Refreshing my understanding of the “Confusion Matrix” and summarizing my it visually in the 3 illustrations below. High five to @joshuastarmer and his amazing Youtube channel “StatQuest with Josh Starmer“.
